R for modellers - Vignette 09
Data wrangling
Julien Arino


Department of Mathematics
University of Manitoba*
* The University of Manitoba campuses are located on original lands of Anishinaabeg, Cree, Oji-Cree, Dakota and Dene peoples, and on the homeland of the Métis Nation.
Vignette 09
Data wrangling
Julien Arino ![]()
![]()
![]()
Department of Mathematics University of Manitoba*
Canadian Centre for Disease Modelling
- The University of Manitoba campuses are located on original lands of Anishinaabeg, Cree, Oji-Cree, Dakota and Dene peoples, and on the homeland of the Métis Nation.
Using dplyr
library(dplyr)
SARS_selected = SARS %>%
  filter(country == ctry)
Create incidence for the selected country. diff does difference one by one, so one less entry than the vector on which it is being used, thus we pad with a 0
SARS_selected$incidence =
  c(0, diff(SARS_selected$totalNumberCases))
Keep only positive incidences (discard 0 or negative adjustments)
SARS_selected = SARS_selected %>%
  filter(incidence > 0)
Plot the result. Before plotting, we need to make the dates column we will use be actual dates..
SARS_selected$toDate =
  lubridate::ymd(SARS_selected$toDate)
Select the data columns needed
SARS_to_plot = SARS_selected %>%
  select(toDate, incidence)
We use a function from incidence2 to format the data as needed for the plot
library(incidence2)
incid = incidence(SARS_to_plot,
                  date_index = "toDate",
                  counts = "incidence")
Finally, we plot using ggplot2
library(ggplot2)
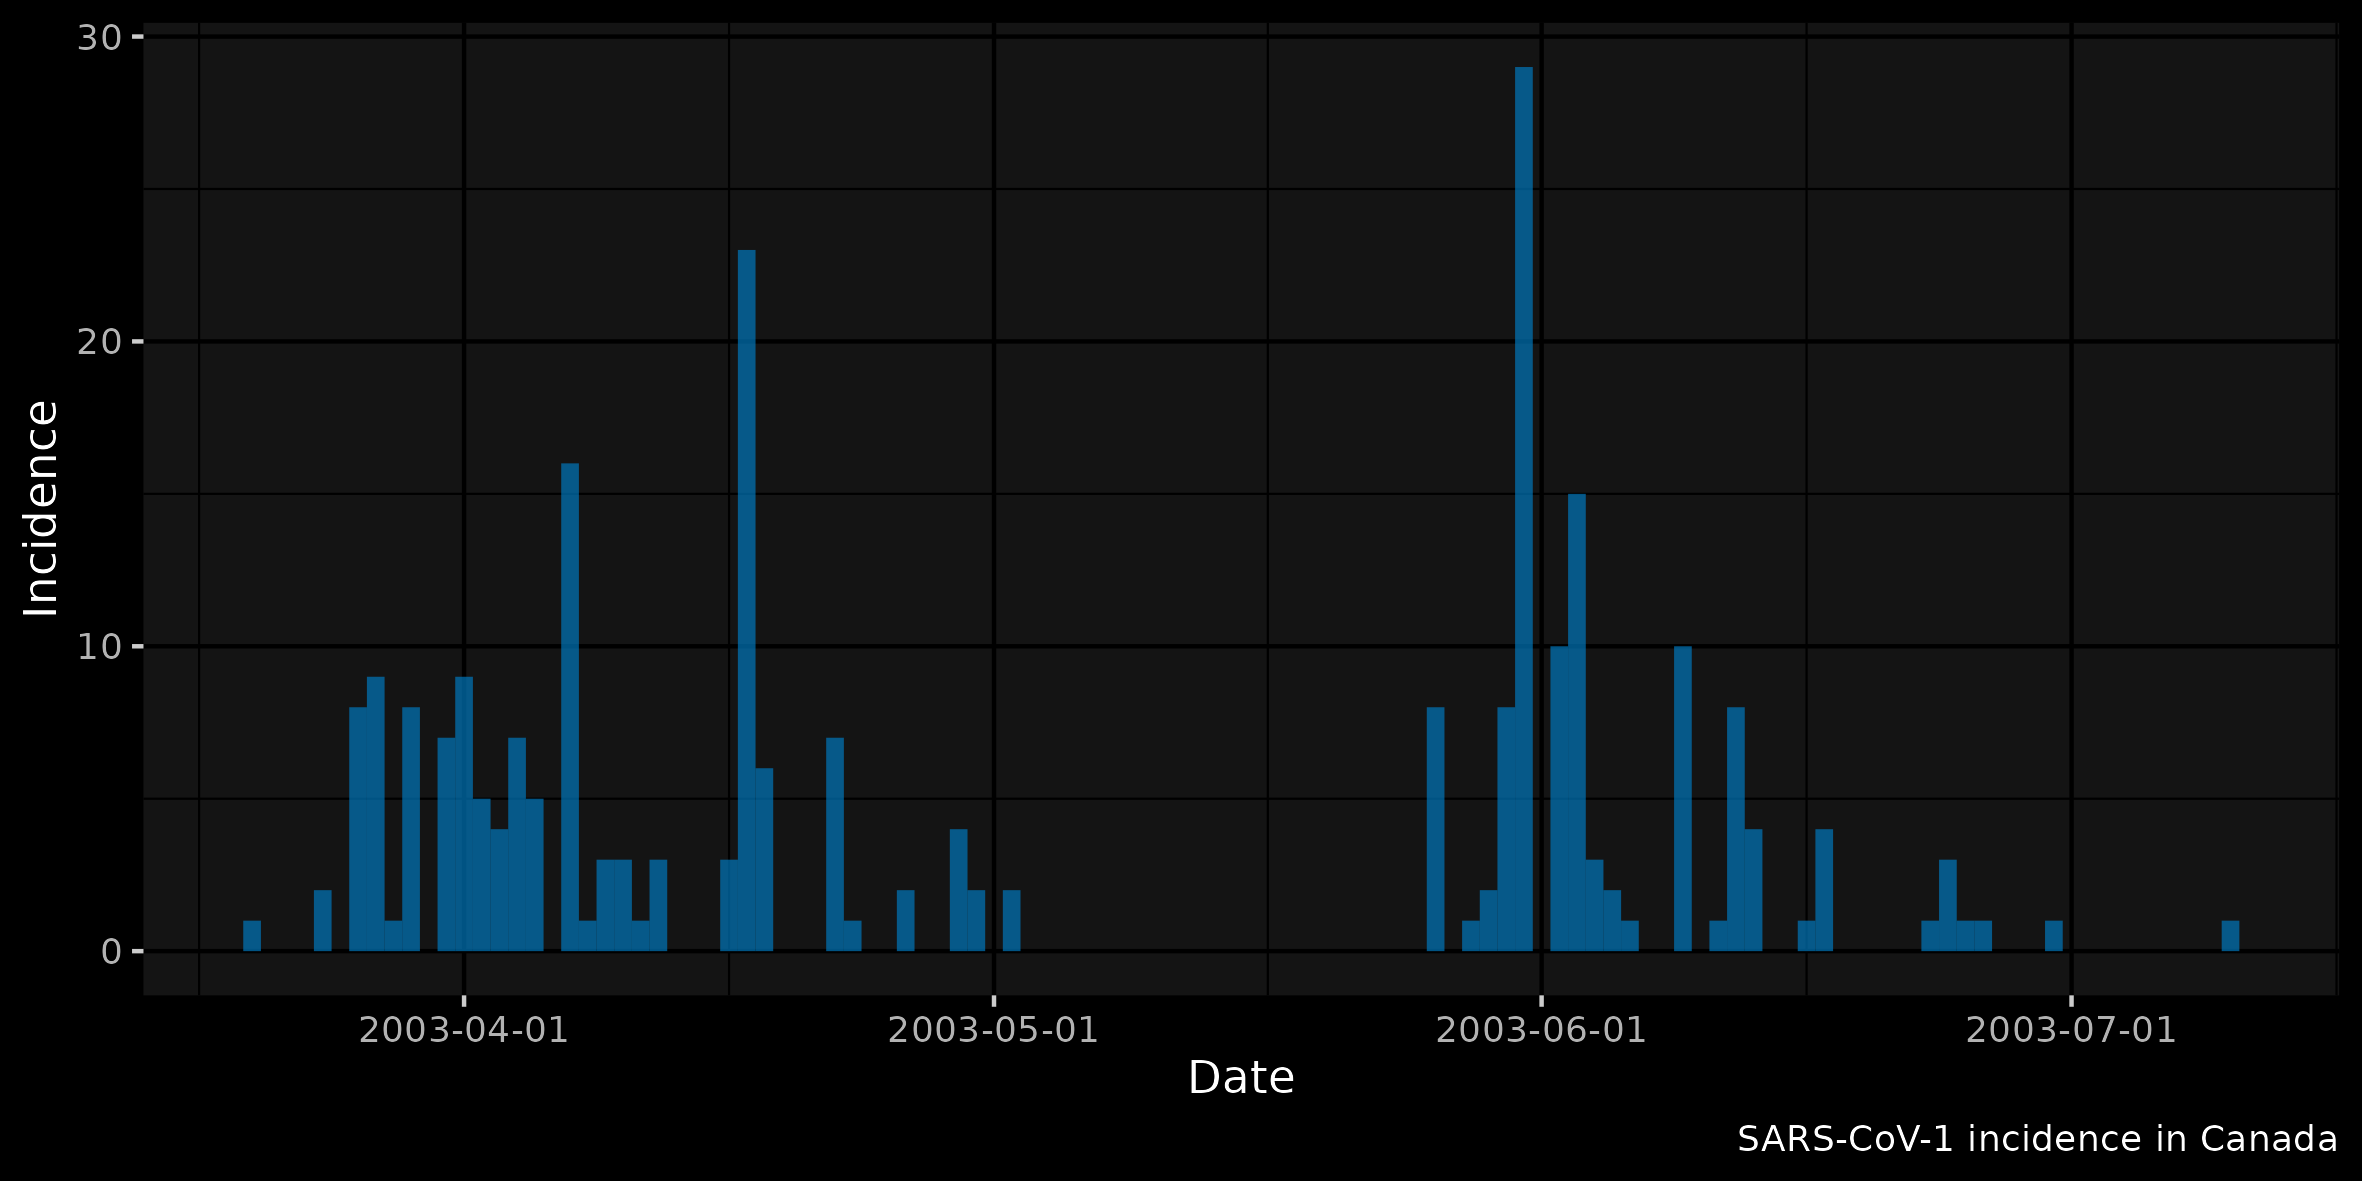
plot(incid) +
labs(fill = "Type") +
xlab("Date") + ylab("Incidence") +
labs(caption =
sprintf("SARS-CoV-1 incidence in %s", ctry)) +
theme(legend.position = "none")(Note that the following plot uses + ggdark::dark_mode())
bg contain