Petit cours d'épidémiologie mathématique

Un petit cours d'une vingtaine d'heures
View the Project on GitHub julien-arino/petit-cours-epidemio-mathematique
Petit cours d’épidémiologie mathématique
Modèles en réseaux
Department of Mathematics & Data Science Nexus University of Manitoba*
Centre canadien de modélisation des maladies (CCDM/CCMM) NSERC-PHAC EID Modelling Consortium (CANMOD, MfPH, OMNI/RÉUNIS)
Plan de ce cours
- Pourquoi des modèles en réseaux
- Les réseaux sociaux
- Cadre général des modèles en réseaux
- La librairie EpiModel
Pourquoi des modèles en réseaux
Comprendre les processus de contact
- Les modèles classiques permettent une certaine flexibilité (voir par exemple la section dans le Cours 04 sur les fonctions d’incidence ou le Cours 11 sur les modèles de groupes), mais cela reste limité et une approximation
- De la même manière que les modèles agents (Cours 18), les modèles en réseaux sont considérés pour rendre plus réaliste la description des processus de contact dans la transmission des agents pathogènes
La vie humaine s’organise en réseaux
- Famille
- Cercles d’amis
- Réseau professionel
- …
- Théorie des réseaux sociaux existe et est utilisée depuis des années, par exemple dans le cadre professionnel (e.g., comment fluidifier les interactions dans une entreprise)
Les réseaux sociaux
- Avant de considérer des épidémies dans des réseaux, quelques notions de réseaux sociaux, parce que c’est utile de façon générale pour comprendre les réseaux
- Les méthodes en réseaux sociaux introduisent des mesures qui permettent d’évaluer certaines propriétés des graphes et qui sont utiles à connaître
- Un réseau est un graphe (mathématique), orienté ou non, dans lequel les arcs représentent les connections (quelles qu’elles soient) entre les individus, qui sont les nœuds du graphe
Contexte
- $\mathcal{G}(\mathcal{V},\mathcal{E})$ un graphe non orienté
- $\mathcal{D}(\mathcal{V},\mathcal{A})$ un digraphe (graphe orienté)
- $\mathcal{V}$ l’ensemble des nœuds (vertices en anglais)
- $\mathcal{E}$ l’ensemble des arcs dans le cas non orienté (edges en anglais)
- $\mathcal{A}$ l’ensemble des arcs dans le graphe orienté (arcs en anglais)
Exemple du réseau de transport aérien
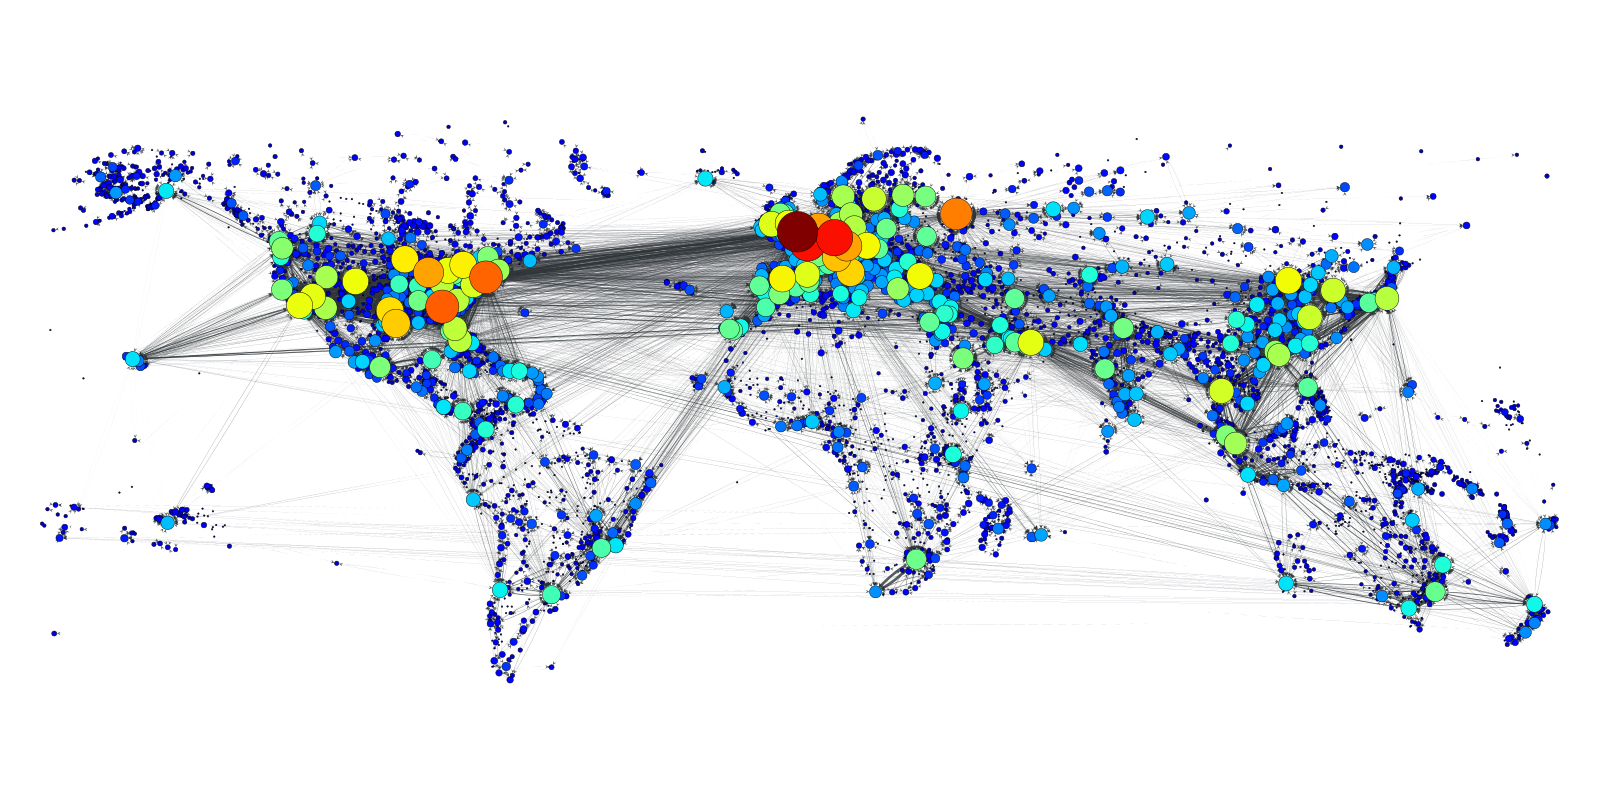
- Je vais illustrer avec des données du réseau de transport aérien mondial
- Données assez bonnes (très bonnes parfois), et un avantage flagrant:
- Quand un avion part de quelque part et arrive ailleurs, c’est quelque chose d’assez .. déterministe


Densité du graphe
Un graph (resp. digraphe) est complet si toute paire de nœuds est connecté (resp. est connecté par un arc dans chaque direction)
| S’il y a $n= | \mathcal{V} | $ nœeuds dans le graphe, alors il y a $n(n-1)/2$ (resp. $n(n-1)$) arcs dans le graphe (resp. digraphe) complet |
(On ne compte pas les connections d’un nœud sur lui même)
Densité de $\mathcal{G}$ (graphe non orienté) \(\mathsf{dens}_\mathcal{G}=\frac{2\ |\mathcal{E}|}{n(n-1)}\) Densité de $\mathcal{D}$ (graphe orienté) \(\mathsf{dens}_\mathcal{D}=\frac{|\mathcal{A}|}{n(n-1)}\)
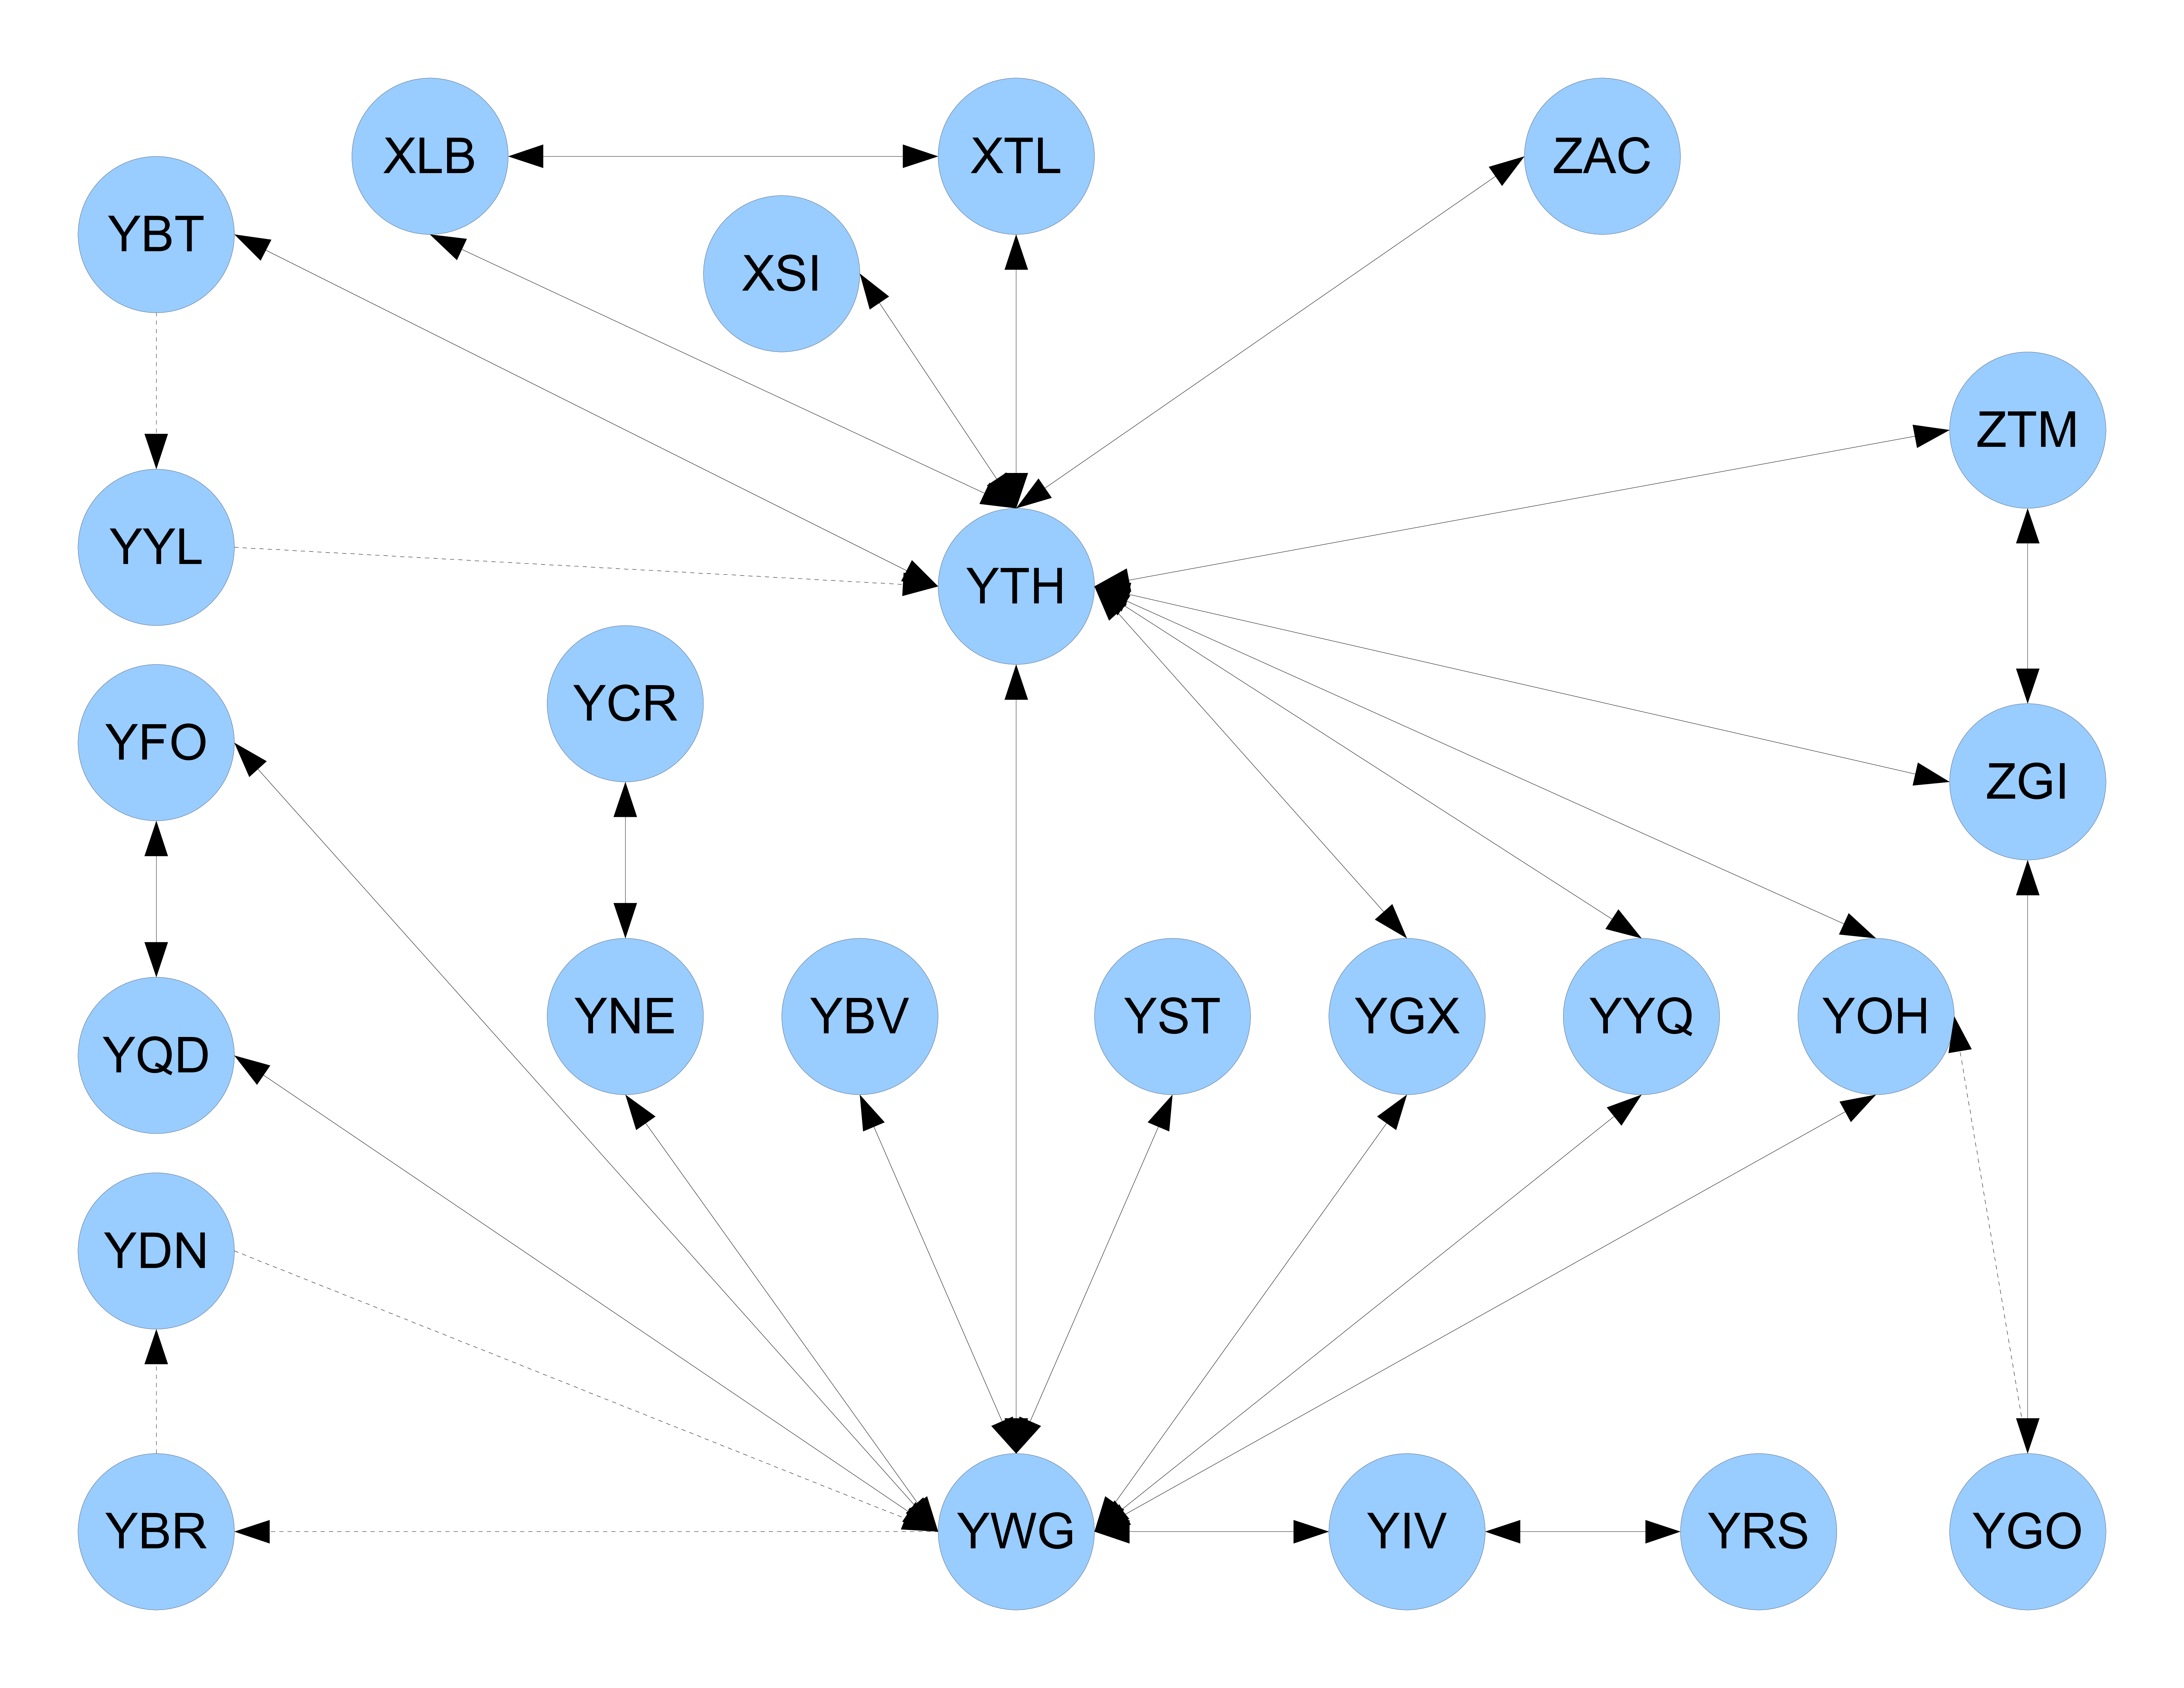
Densité des digraphes considérés
| Digraphe | # nœuds | # arcs | densité |
|---|---|---|---|
| Manitoba | 24 | 64 | 0.1159 |
| Canada | 222 | 804 | 0.0164 |
| Amérique du Nord | 934 | 7,814 | 0.009 |
| Global | 3403 | 32,576 | 0.0028 |
Degré
Degré $d_\mathcal{G}(v)$ du nœud $v\in\mathcal{V}$ dans $\mathcal{G}$: nombre d’arcs incidents à $v$
Degré entrant $d^-_\mathcal{D}(v)$ du nœud $v\in\mathcal{V}$ dans $\mathcal{D}$: nombre d’arcs avec tête $v$
Degré sortant $d^+_\mathcal{D}(v)$ du nœud $v\in\mathcal{V}$ dans $\mathcal{D}$: nombre d’arcs avec queue $v$
Degré $d_\mathcal{D}(v)$ du nœud $v\in\mathcal{V}$ dans $\mathcal{D}(\mathcal{V},\mathcal{A})$: nombre d’arcs incidents à $v$ dans le graphe non orienté sous-jacent $\mathcal{G}$ de $\mathcal{D}$ (où tout arc est considérée comme un arc “bidirectionnel”)
Degré entrant global du réseau de transport aérien
| Ville | Pays | Degré entrant | Rang |
|---|---|---|---|
| Londres | GB | 365 | 1 |
| Paris | France | 294 | 2 |
| Frankfurt | Allemagne | 287 | 3 |
| Atlanta | USA | 249 | 4 |
| New York | USA | 241 | 5 |
| Moscou | Russie | 225 | 6 |
| Amsterdam | Pays-Bas | 204 | 7 |
| Chicago | USA | 203 | 8 |
| Munich | Allemagne | 200 | 9 |
| Milan | Italie | 181 | 10 |
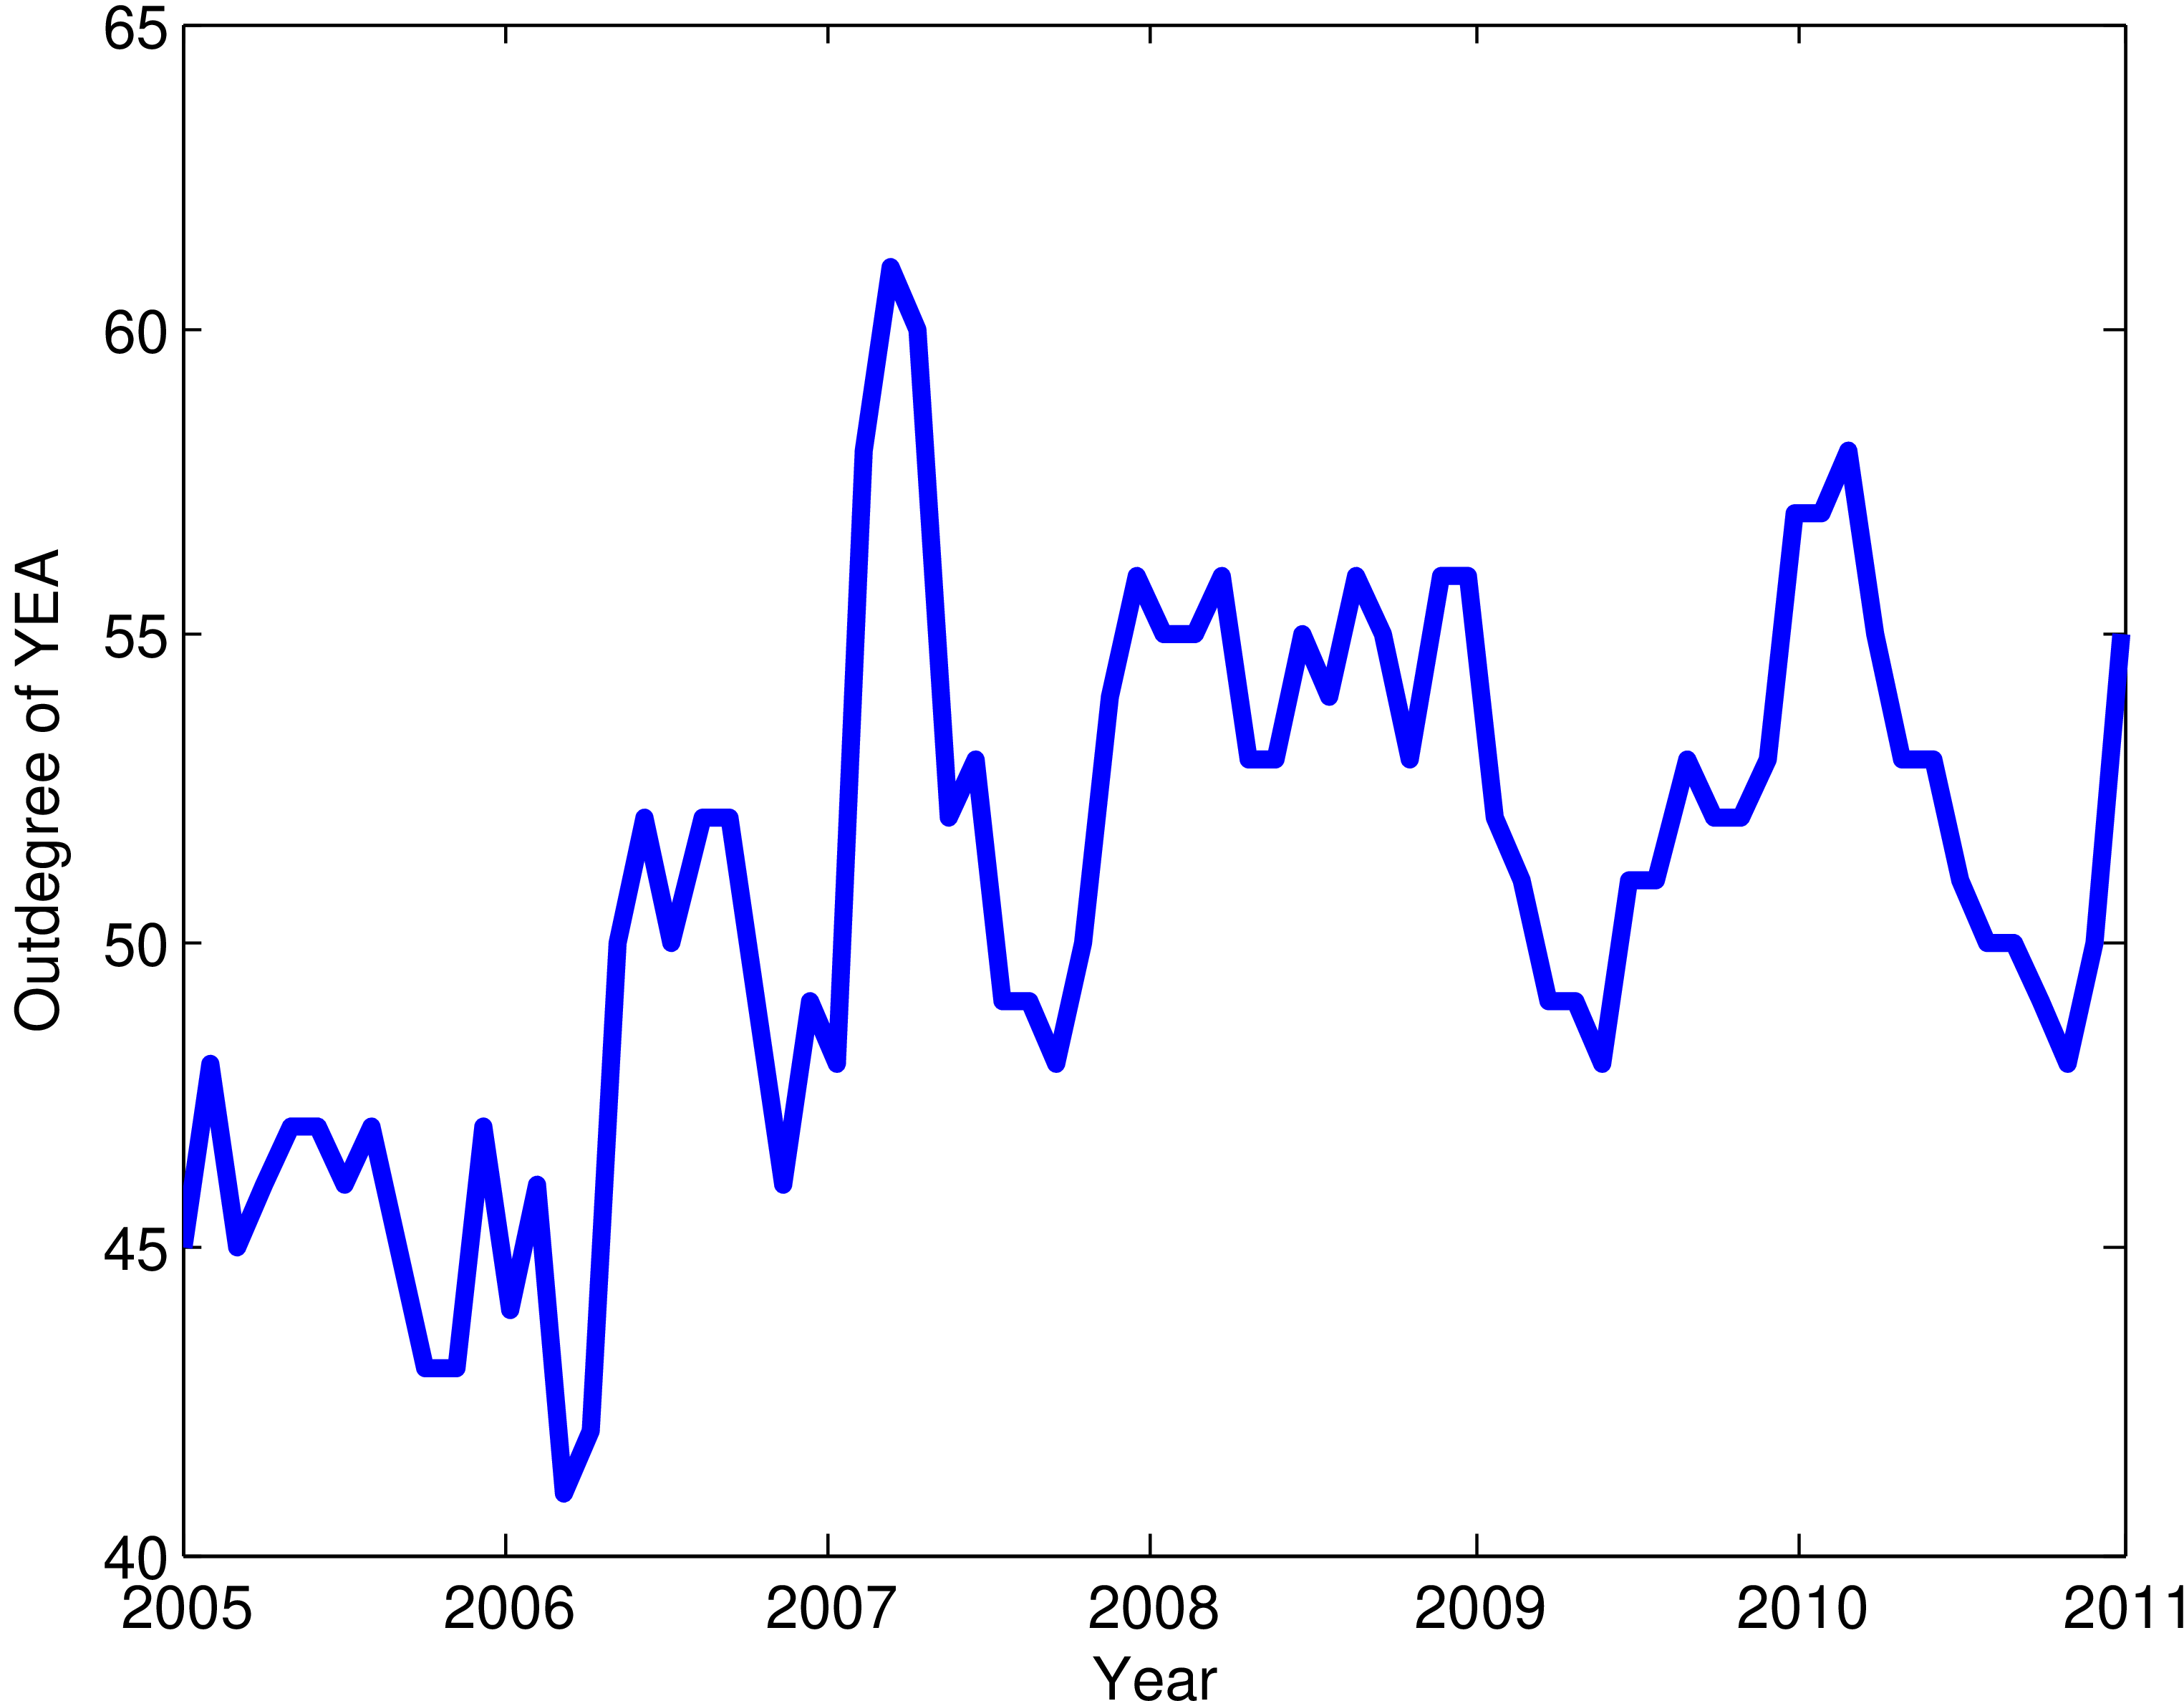
Le degré change pendant l’année
Les graphes sont dynamiques !

Plus court chemin
Soit $\mathcal{D}$ un digraphe. Le (ou les) plus court(s) chemin(s) de $i$ à $j$ dans $\mathcal{V}$: \(d_\mathcal{D}(i,j)=\min_{p\in\mathcal{P}(i,j)} f(p)\) où $\mathcal{P}(i,j)$ est l’ensemble des chemins de $i$ à $j$ et $f(p)$ est un valuation des arcs dans le chemin $p$. On définit $d_\mathcal{D}(i,j)=\infty$ s’il n’existe pas de chemin de $i$ à $j$
$f(p)$ peut être
- le nombre d’arcs dans $p$ de $i$ à $j$ (distance géodésique)
- Distance du grand cercle des arcs de $p$
- durée des vols des arcs de $p$
Excentricité
Excentricité (ou nombre de Köonig) du nœud $v\in\mathcal{V}$ dans $\mathcal{G}(\mathcal{V},\mathcal{E})$ \(e(v)=\max_{v'\in\mathcal{V}}d_\mathcal{D}(v,v')\) Excentricité entrante du nœud $v\in\mathcal{V}$ dans $\mathcal{D}(\mathcal{V},\mathcal{A})$ \(e^-(v)=\max_{v'\in\mathcal{V}}d_\mathcal{D}(v',v)\) Excentricité sortante du nœud $v\in\mathcal{V}$ dans $\mathcal{D}(\mathcal{V},\mathcal{A})$ \(e^+(v)=\max_{v'\in\mathcal{V}}d_\mathcal{D}(v,v')\)
| Graphe | $e^-(YWG)$ | $e^+(YWG)$ |
|---|---|---|
| Manitoba | 2 | 3 (Lynn Lake) |
| Canada | 7 $^{(*)}$ | 7 $^{(*)}$ |
| Amérique du Nord | 7 $^{(**)}$ | 8 (Stony River) |
| Global | 7 $^{(***)}$ | 8 (Stony River) |
| ( * ) | Peawanuck (ON), Port Hope Simpson (NL) |
| ( ** ) | ( * ) + Lopez Island, Kwethluk, Chuathbaluk |
| ( *** ) | ( ** ) + Hooker Creek, Birdsville, Beni, Balalae, Thargomindah |
Rayon
Rayon de $\mathcal{G}$ \(\rho_\mathcal{G}=\min_{v\in\mathcal{V}}e(v)\) Rayon entrant de $\mathcal{D}$ \(\rho_\mathcal{D}^-=\min_{v\in\mathcal{V}}e^-(v)\) Rayon sortant de $\mathcal{D}$ \(\rho_\mathcal{D}^+=\min_{v\in\mathcal{V}}e^+(v)\)
rayon = $\min(\max(\cdot))$ $\rightarrow$ directionalité
Rayon du réseau de transport aérien
| Graphe | $\rho^-$ | $\rho^+$ |
|---|---|---|
| Manitoba | 2 | 3 |
| Canada | 6 | 6 |
| Amérique du Nord | 6 | 7 |
| Global | 7 | 7 |
Centre d’un graphe
Centre de $\mathcal{D}$: \(\mathcal{C}_\mathcal{D}=\left\{v\in\mathcal{V}:e(v)=\rho_\mathcal{D}\right\}\)
Centre du réseau de transport aérien
| Graphe | $\mathcal{C}^-$ | $\|\mathcal{C}^-\|$ | $\mathcal{C}^+$ | $\|\mathcal{C}^+\|$ |
|---|---|---|---|---|
| Manitoba | 2 | 1 (YWG) | 3 | 7 |
| Canada | 6 | 1 (YTO) | 6 | 1 (YTO) |
| Amérique du Nord | 6 | 1 (YTO) | 7 | 18 |
| Global | 7 | 131 | 7 | 20 |
${$YYC,YEA,Halifax,Kelowna,Moncton,YMQ,YOW,Quebec,St John’s,YTO,YVR, Victoria,YWG$}\subset\mathcal{C}^-$
${$Toronto,Vancouver$}\subset\mathcal{C}^+$
Diamètre
Diamètre de $\mathcal{D}$ \(\mathsf{diam}_\mathcal{D}=\max_{v\in\mathcal{V}}e(v)\)
diamètre = max(max(.)) $\rightarrow$ pas de directionalité
| Graphe | Diamètre | |
|---|---|---|
| Manitoba | 5 | |
| Canada | 12 | |
| Amérique du Nord | 13 | |
| Global | 13 |
Péripherie d’un graphe
Péripherie de $\mathcal{D}$ \(\mathcal{P}_\mathcal{D}=\left\{v\in\mathcal{V}:e(v)=\mathsf{diam}_\mathcal{D}\right\}\)
| Graphe | Péripherie entrante | Péripherie sortante | |
|---|---|---|---|
| Manitoba | Lynn Lake | Cross Lake, Red Sucker Lake, Brandon | |
| Canada | Peawanuck | Peawanuck, Port Hope Simpson | Port Hope Simpson |
| Amérique du Nord | Stony River | Peawanuck, Port Hope Simpson | |
| Global | Stony River, Hooker Creek, Peawanuck | Hooker Creek, Beni, Peawanuck, Port Hope Simpson |
Bien d’autres mesures
- betweenness
- closeness
- $k$-cores
- $\ldots$
Cadre général des modèles en réseaux
- Voir par exemple
- Newman. Spread of epidemic disease on networks, 2002
- Keeling & Eames. Networks and epidemic models, 2005
- Meyers, Pourbohloul, Newman, Skowronski & Brunham. Network theory and SARS: predicting outbreak diversity, 2005
- Meyers, Newman & Pourohloul. Predicting epidemics on directed contact networks, 2006
- Bansal, Read, Pourbohloul & Meyers. The dynamic nature of contact networks in infectious disease epidemiology, 2010
- Typiquement, on considère un graphe (ou digraphe selon les cas) dans lequel:
- chaque nœud est un individu
- l’existence d’un arc de $i$ vers $j$ indique que $i$ est en contact avec $j$ et peut lui transmettre l’infection
- dans le cas non orienté, l’existence d’un arc de $i$ vers $j$ implique celle d’un arc (le même) de $j$ vers $i$ et établit que les deux individus sont connectés
- La connexion n’est pas permanente, mais décrit plutôt la possibilité d’une connexion: $i$ et $j$ entrent en contact de façon régulière
Matrice d’adjacence
On utilisera souvent la matrice d’adjacence $A=[a_{ij}]$, dans laquelle $a_{ij}=1$ si le nœud $i$ a un lien vers le nœud $j$ et $a_{ij}=0$ sinon
On écrit parfois $A(\mathcal{D})$ pour indiquer que $A$ est la matrice d’adjacence du digraphe $\mathcal{D}$, et dans l’autre sens, $\mathcal{D}(A)$ pour indiquer que le graphe est construit en utilisant la matrice d’adjacence
Si le graphe est non orienté, alors $A$ est symmétrique
Nature du réseau
- Parfois on dispose de données précises sur les liens entre individus (sondages, etc.)
- Souvent on idéalise des réseaux, on choisit des réseaux avec des propriétés données
La distribution des degrés du (di)graphe
La transmissibilité $T$ d’une maladie dans un graphe est la probabilité moyenne qu’un individu infectieux transmette la maladie à un individu susceptible avec qui il/elle est en contact
Dans un réseau non corrélé, \(T_c = \frac{\langle k\rangle}{\langle k^2\rangle-\langle k\rangle}\) où $\langle k\rangle$ et $\langle k^2\rangle$ sont le degré moyen et la moyenne du carré du degré
Il est nécessaire que $T>T_c$ pour qu’un outbreak devienne une épidémie majeure
La librairie EpiModel
EpiModel
- Librairie R qui fournit des outils pour simuler et analyser des modèles épidémiologiques en réseaux
- Fournissent deux types d’approches:
- Simulation des modèles compartimentaux EDO (pas très intéressant)
- Simulation des modèles réseaux
- Leur site web contient quelques tutoriaux utiles
- Fait partie de la méta-librairie statnet

