US measles cases data
I am currently finishing up some work started ages ago that deals with spatial aspects in vaccination. The work was motivated by an outbreak of polio that started in northern Nigeria in 2002-2003, following a vaccine scare episode. In order to illustrate the benefits of vaccination, in these days of elevated anti-vaccine activity, I like to use the example of measles. The US data is available online, although like the SARS data that I discussed elsewhere, getting the entire dataset requires a bit of editing. So this post will serve as a means to disseminate the result of my editing of that data. And produce a graph of said data.
Measles strikes close to home for me: as a six year old kid, despite having received vaccination, I caught measles. (The vaccine, especially in early years, was not always most efficacious. This is one of the reasons it was later recommended to administer a booster shot, which makes the vaccine extremely efficacious; see below.)
Update: In 2019, there were a total of 1,282 cases of measles in the US, occurring in 31 states. That is the most cases since the effect of the double dose of vaccine kicked in in the early nineties!
Update: In 2020, COVID-19 and resulting social distanciation and restriction of international travel oblige, there were very few cases, the fewest ever.
Two plots
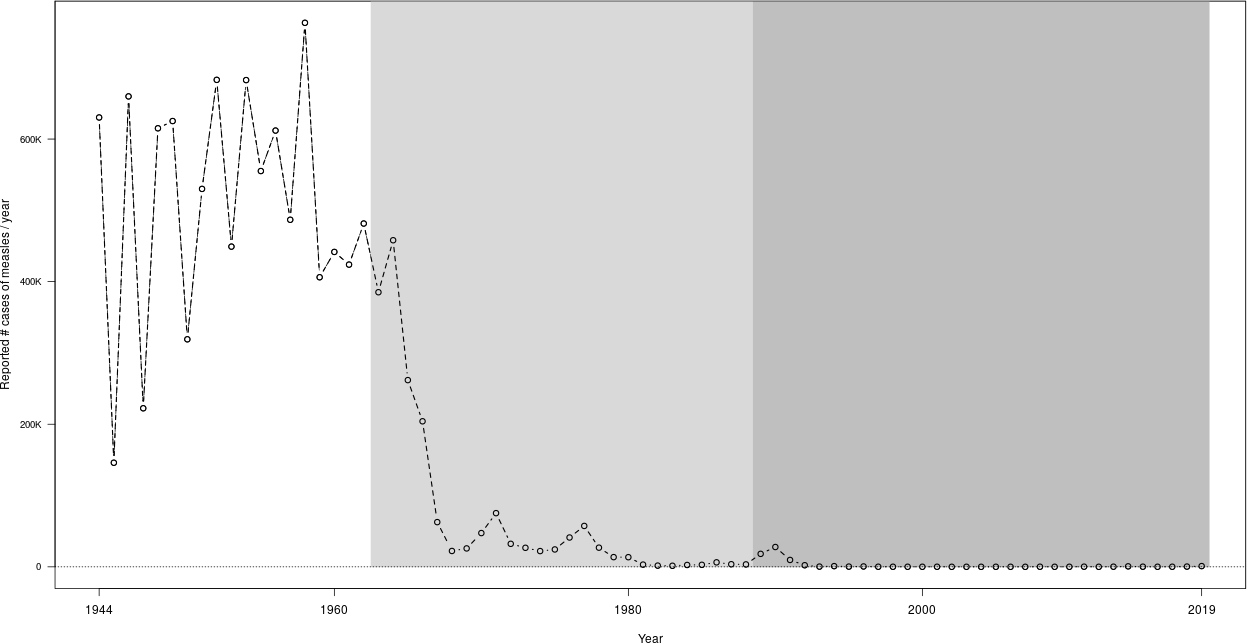
The first plot is of the reported measles cases in the US during the entire period covered by the data.

Illustrated are the three main eras in measles in this data:
- The pre-vaccine era, which lasted until vaccination started in earnest in 1963.
- The single-dose vaccine era, from 1963 to 1989.
- After 1989, it was recommended to use two shots (an initial shot and a booster shot).
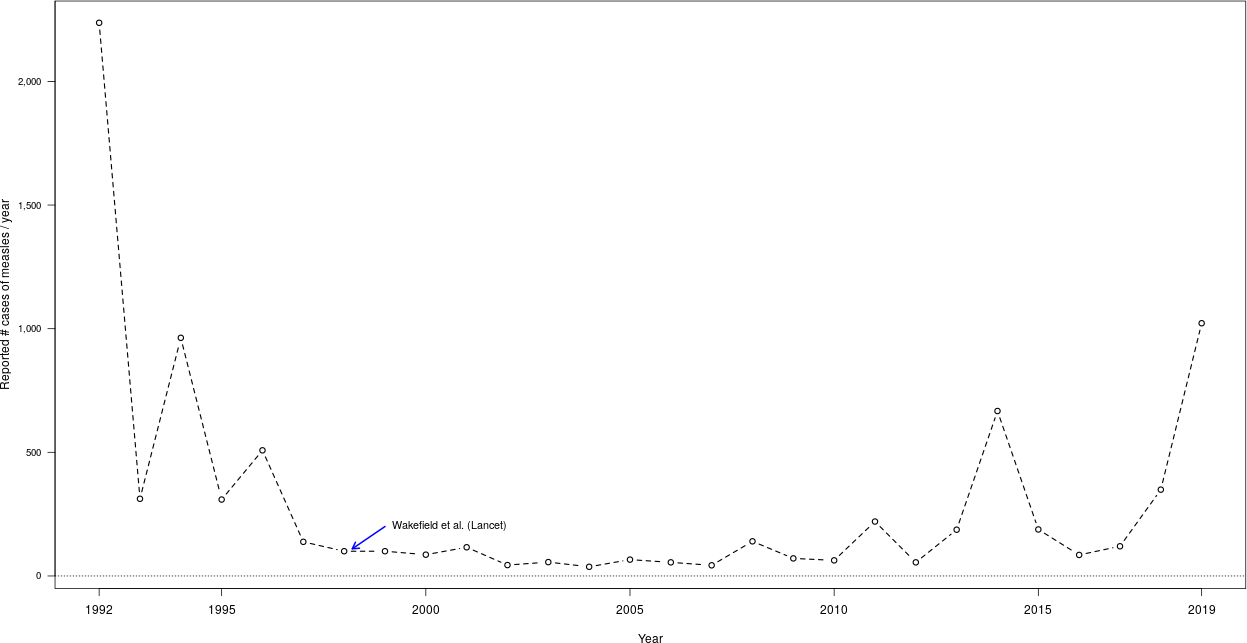
The second plot focuses on recent events, with particular focus on one of the roots of anti-vaccine activism.

Here, I show the behaviour of measles since 1992. Of particular note here is the publication in the 28 February 1998 issue of The Lancet of an infamous paper by Wakefield and others that purported to show a link between the MMR vaccine and autism. It took a few years for the effect to be felt, but now, we see regular small outbreaks. The situation is often the following: unvaccinated (US) individual goes abroad, gets infected, comes home and infects a few unvaccinated people.
The Wakefield paper has since been retracted, Wakefield himself has been discredited (although he does retain some influential supporters) and banned from practicing medicine in the UK (his country), but as often with vaccine scares, the scars remain.
Data files
- Concatenated US Centers for Disease Control and Prevention Morbidity and Mortality Weekly Report for notifiable diseases, aggregated by year, from 1944 to 1993 and by month for 1994 and 1995: file. This file contains the raw data.
- Yearly number of reported cases of measles in the USA from 1944 to 2020: file. For the period 1944 to 1995, the data comes from the file above. For the years following, data originates from more dynamic pages at CDC.
Some remarks about making the plots
I recently split this post in two. The part explaining how to make axes legible by humans is now here.